How much do you know about your local laboratory? Do you know the limitations regarding your biochemistry endocrine results? Do you know which assay system is used to determine each result? Is it an immunoassay or mass spectrometry method? If it’s immunoassay, do you know which equipment is used?
Do you know which tests are performed in-house and which are sent away? Do you know the current assay performance? Do you have patients whose samples are analysed at a different laboratory, either prior to referral or as part of their management pathway?
You are probably thinking that you don’t need to know the answers to these questions, as all assays should give you the same result. They don’t. You can’t assume that you will get the same result on different assay systems. Likewise, you can’t assume that assay performance is, and will always be, stable over time. This is not new; it has always been the case.1–3
This article highlights some of the key areas that you, as a clinician, should consider and question with any analytical result.
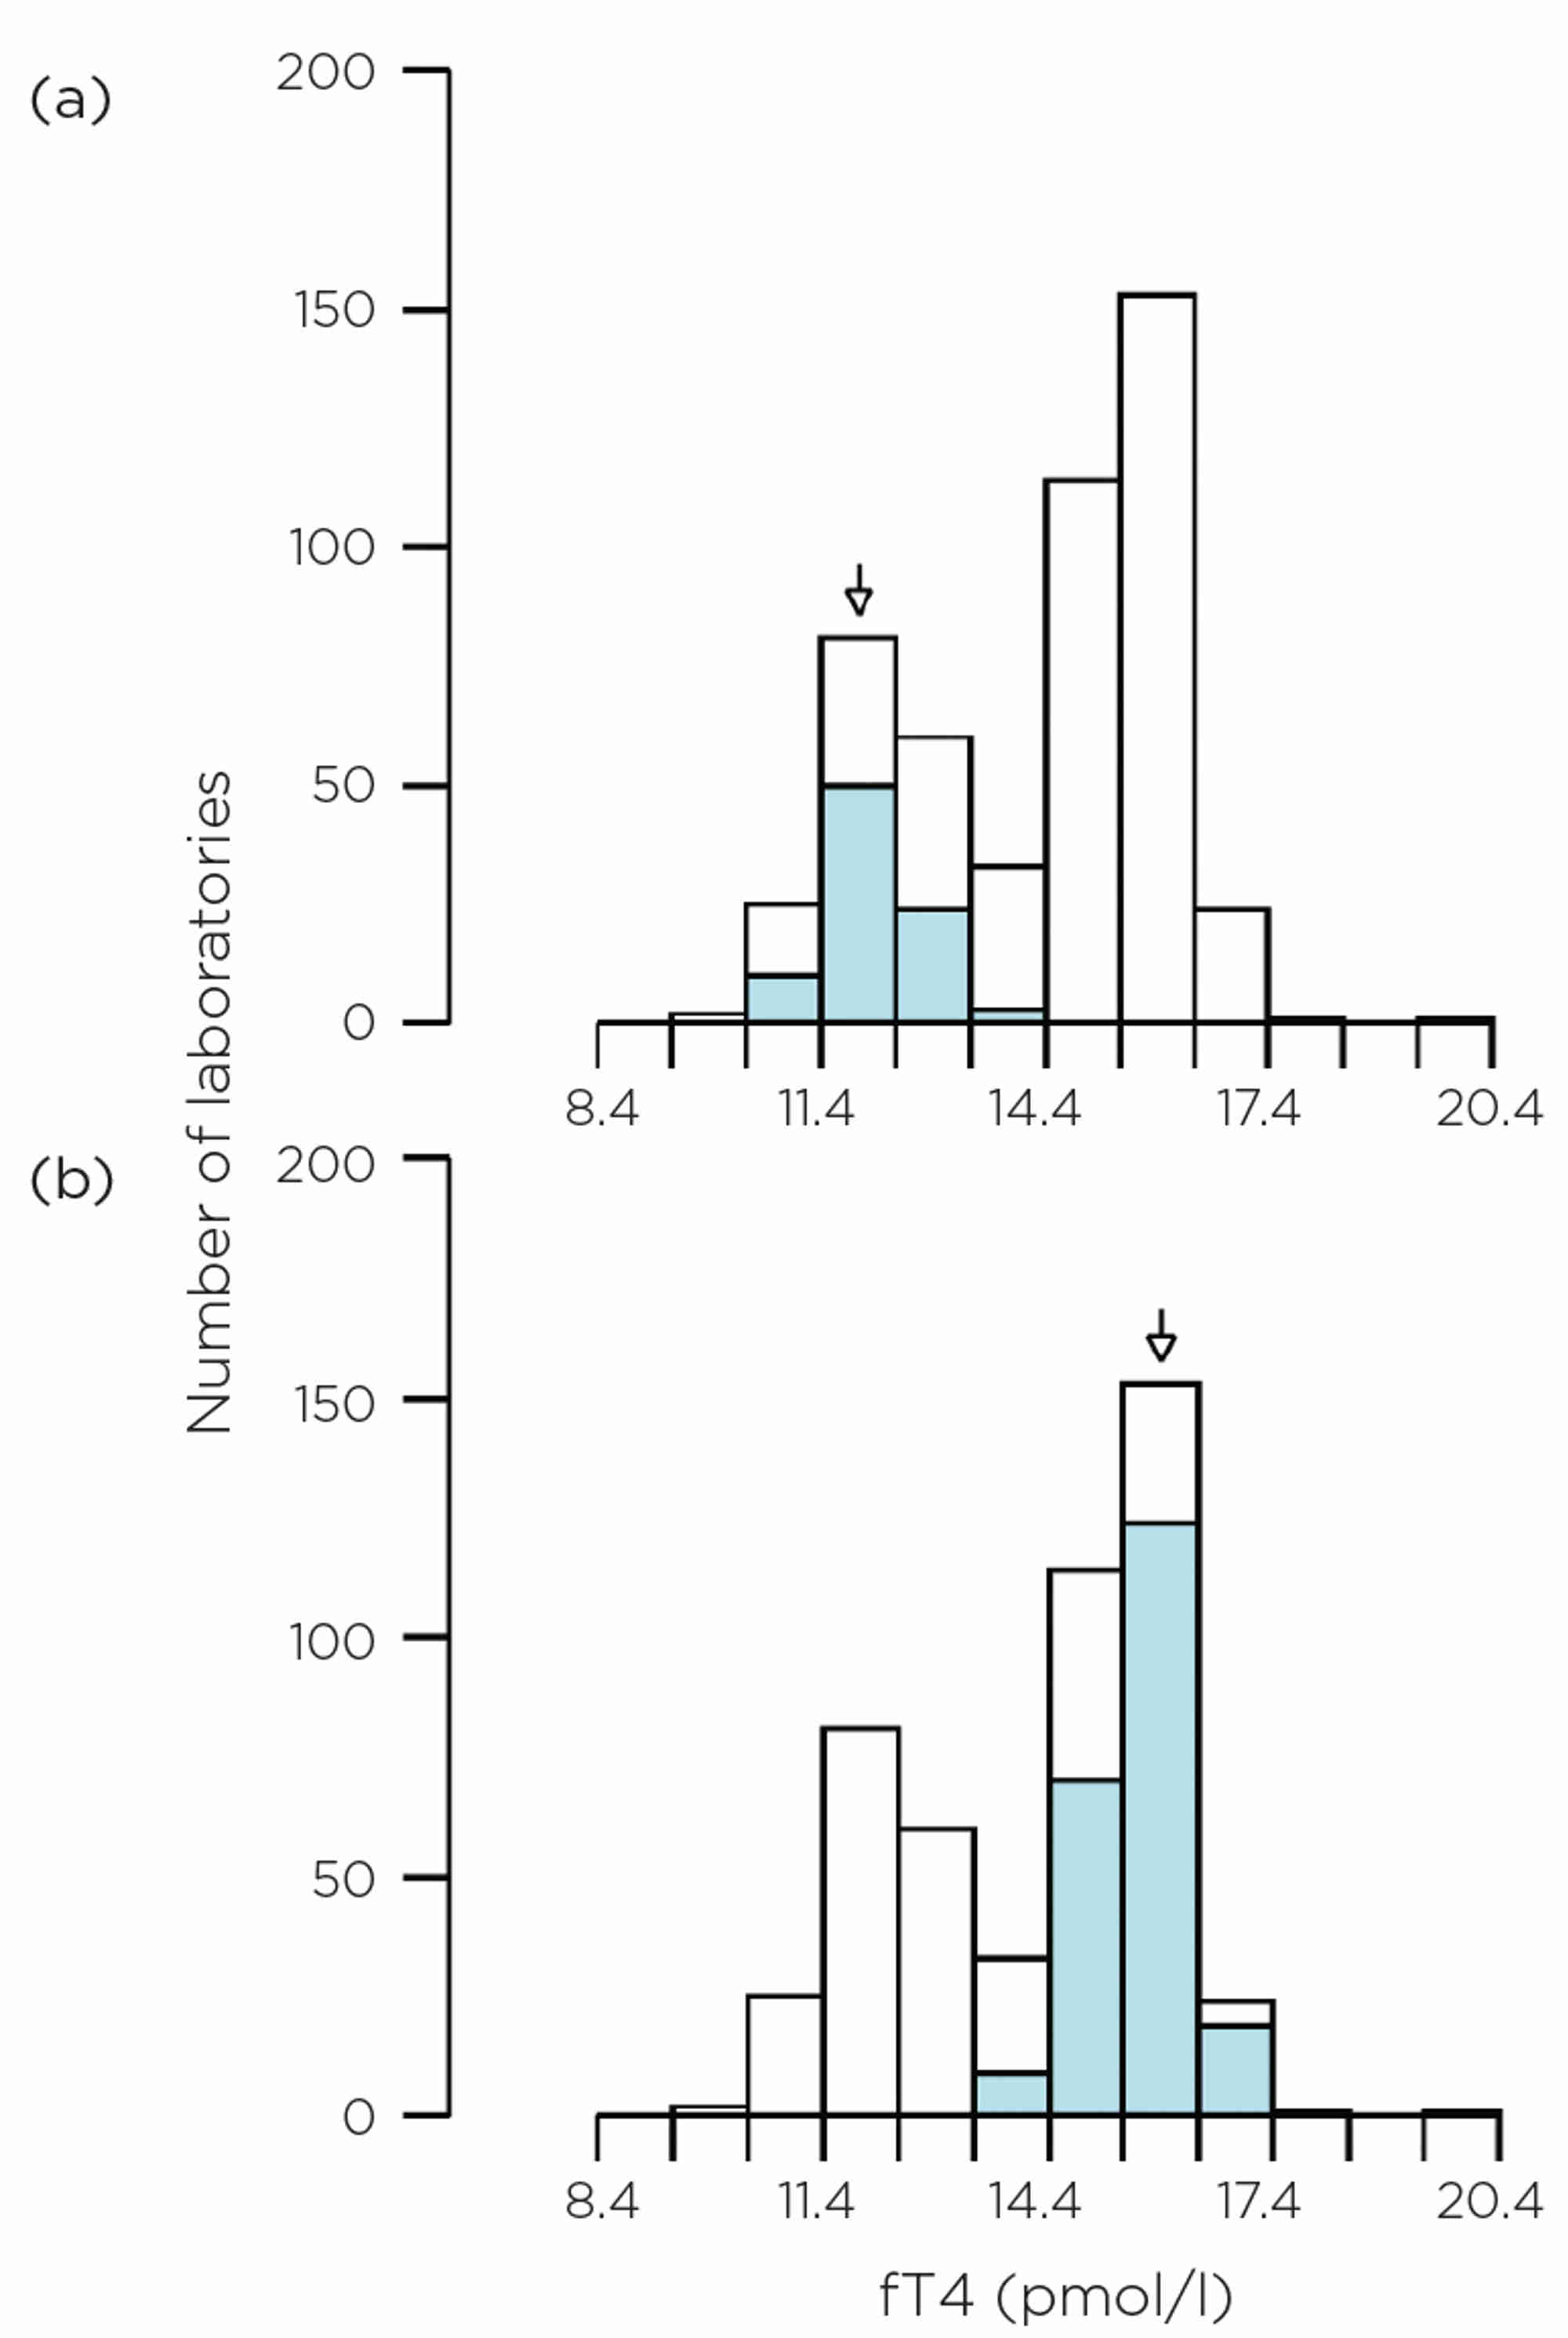
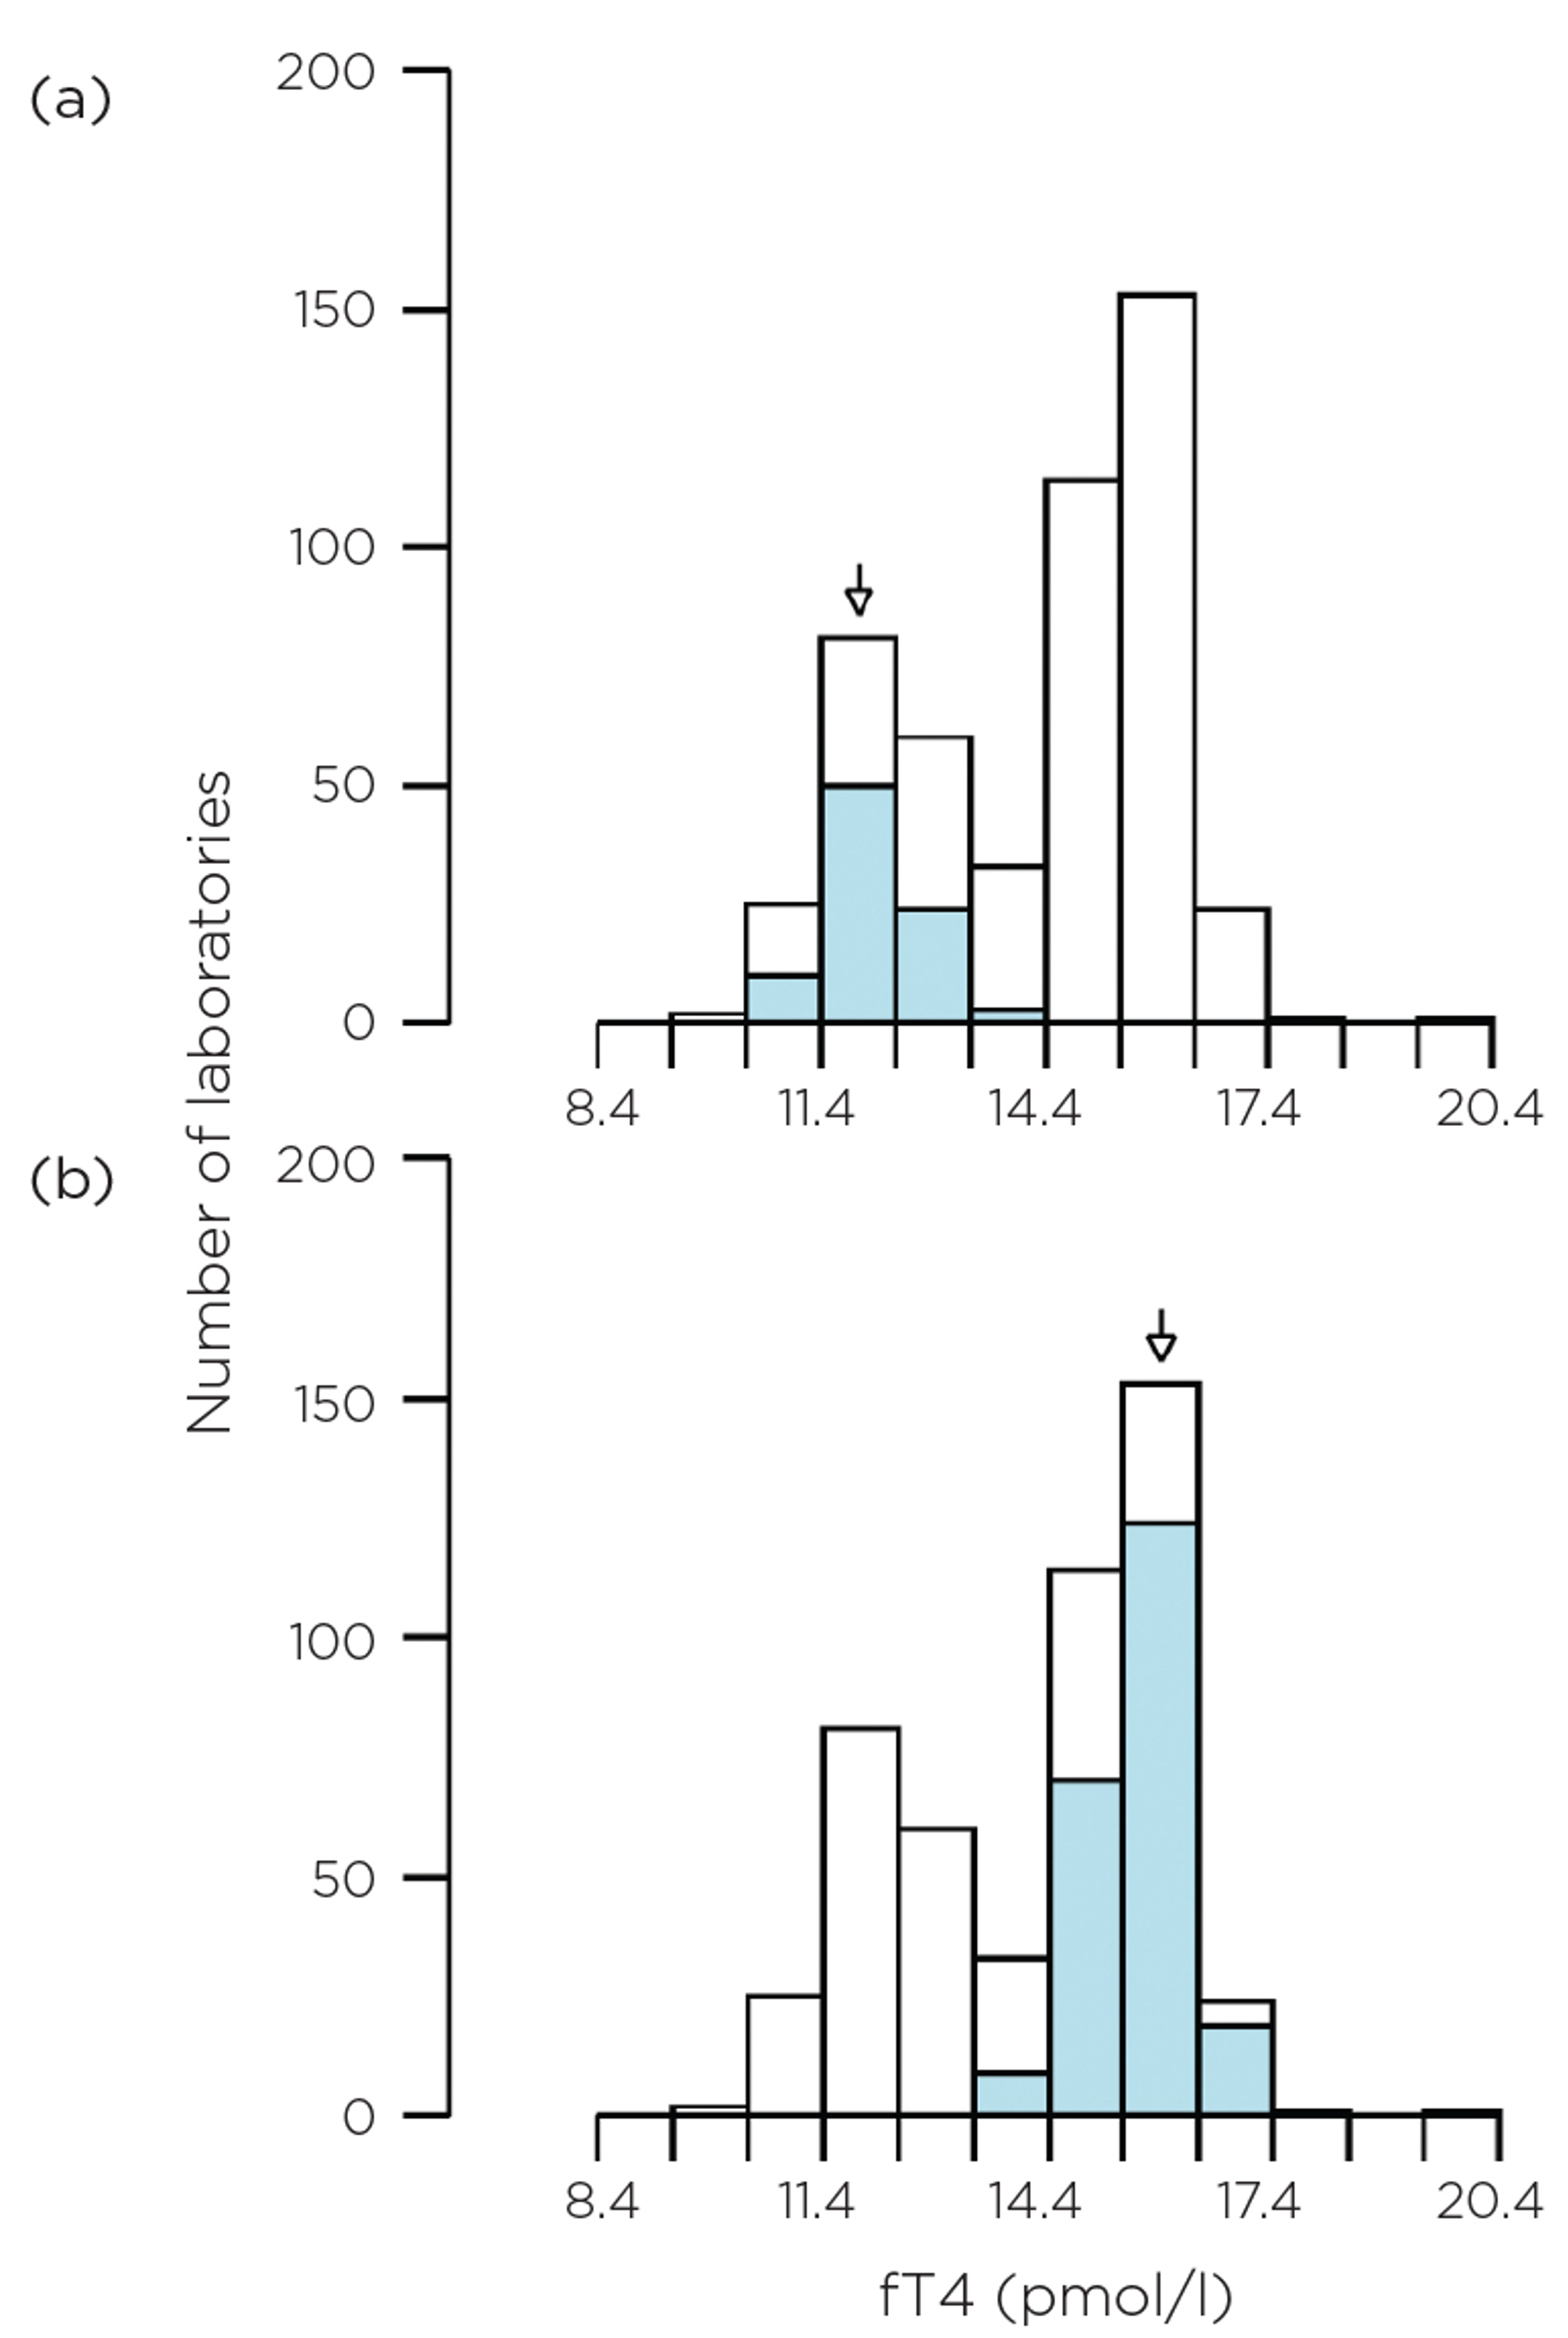
Figure 1. EQA data for fT4 in 2023 on an unmanipulated, native, euthyroid, pooled human serum. The histogram shows all data, but the blue-coloured sections are for (a) Abbott Alinity and (b) Roche Cobas respectively.
HOW A ROUTINE LABORATORY OPERATES
Automation has been universal in clinical laboratories over the last two decades. The advantages are clear to see with regard to processing power and workflow. However, one of the main limitations is that laboratories are usually restricted to a single equipment provider for all their assays.
The majority of endocrine results will have been determined by an immunoassay. However, some laboratories do have access to mass spectrometers for some analytes, such as steroids. Mass spectrometry methods provide greater specificity for the analyte in question, whereas immunoassays are inherently non-specific and show wider variability, as is shown in the examples below.
The number of tests processed by a laboratory has rapidly increased over the years, in terms of both repertoire and volume of work. This means that a laboratory may now have multiple analysers performing the same assay. Laboratories increasingly form ‘networks’ with neighbouring laboratories. This is beneficial in terms of resilience, but the equipment, reference ranges, etc., may be different. All of these factors contribute to the analytical variation.
Workforce requirements have also changed over time. When assays were more manual and in-house, the scientist would have had a greater understanding of their architecture and limitations. The ‘black box’ effect of automation has removed the need for this knowledge, but the patient complexities have not changed.
MANUFACTURER DIFFERENCES
An example is shown here of external quality assessment (EQA) data for free thyroxine (fT4) from pooled human serum (Figure 1). The two most common methods in the UK at present are (a) Abbott Alinity and (b) Roche Cobas, which give very different results. This isn’t a unique case for fT4; it has been the position for a number of years. Variation is also observed for thyrotrophin, which may make the diagnosis and monitoring of thyroid disorders more challenging if guidelines are used which have single, method-independent cut-offs. Significant progress has been made towards global standardisation of fT4 assays, but there are still several challenges.4
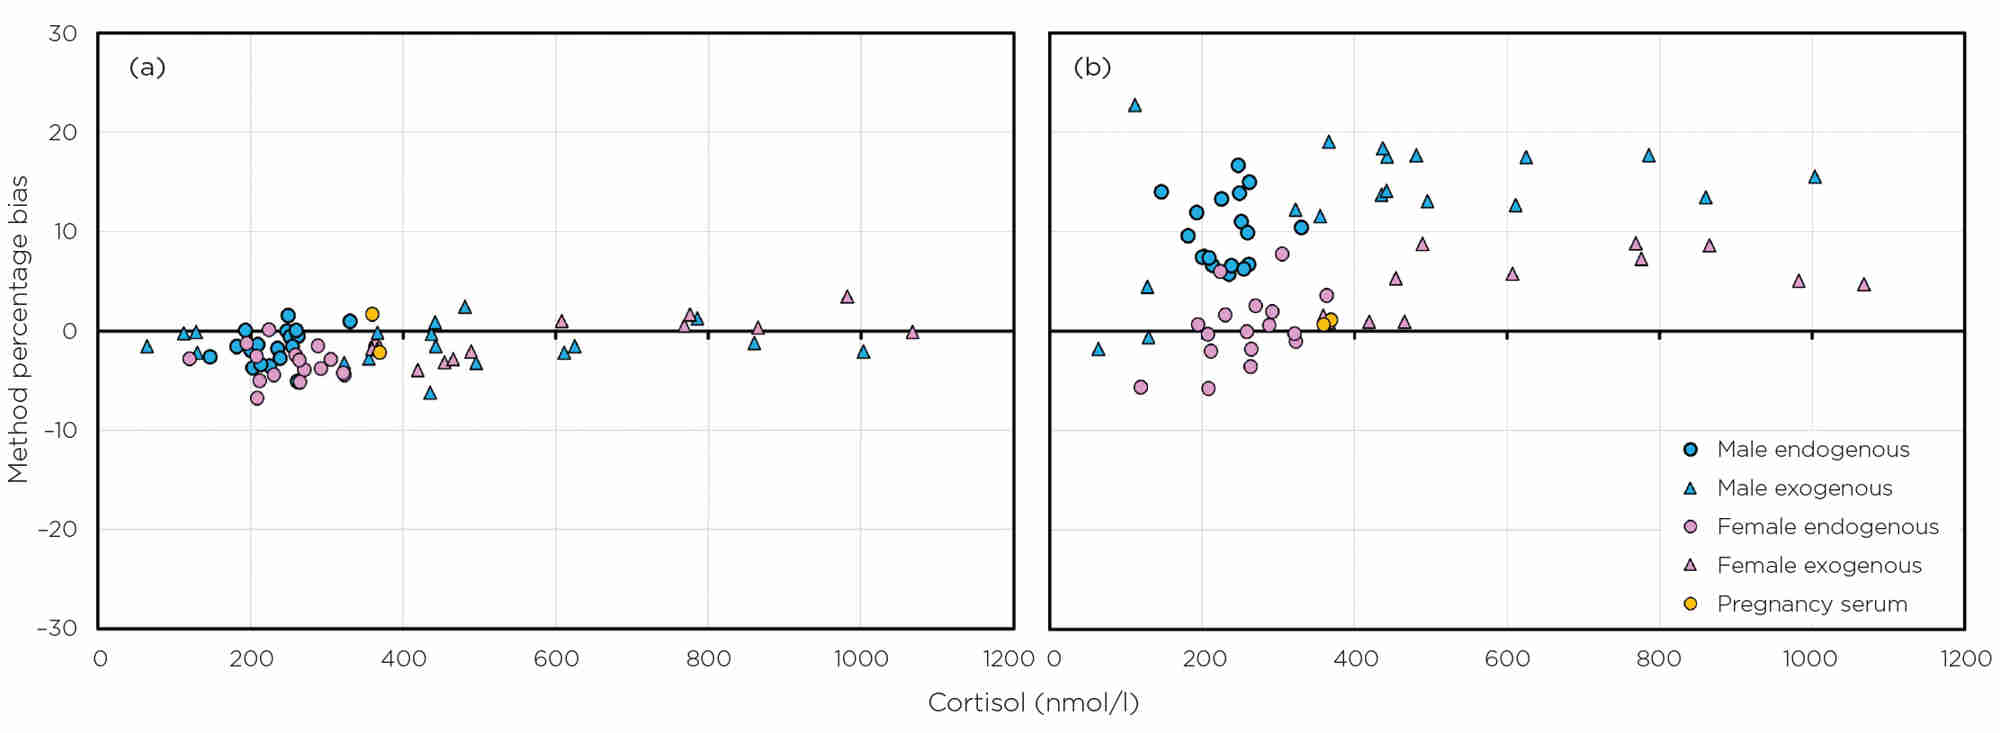
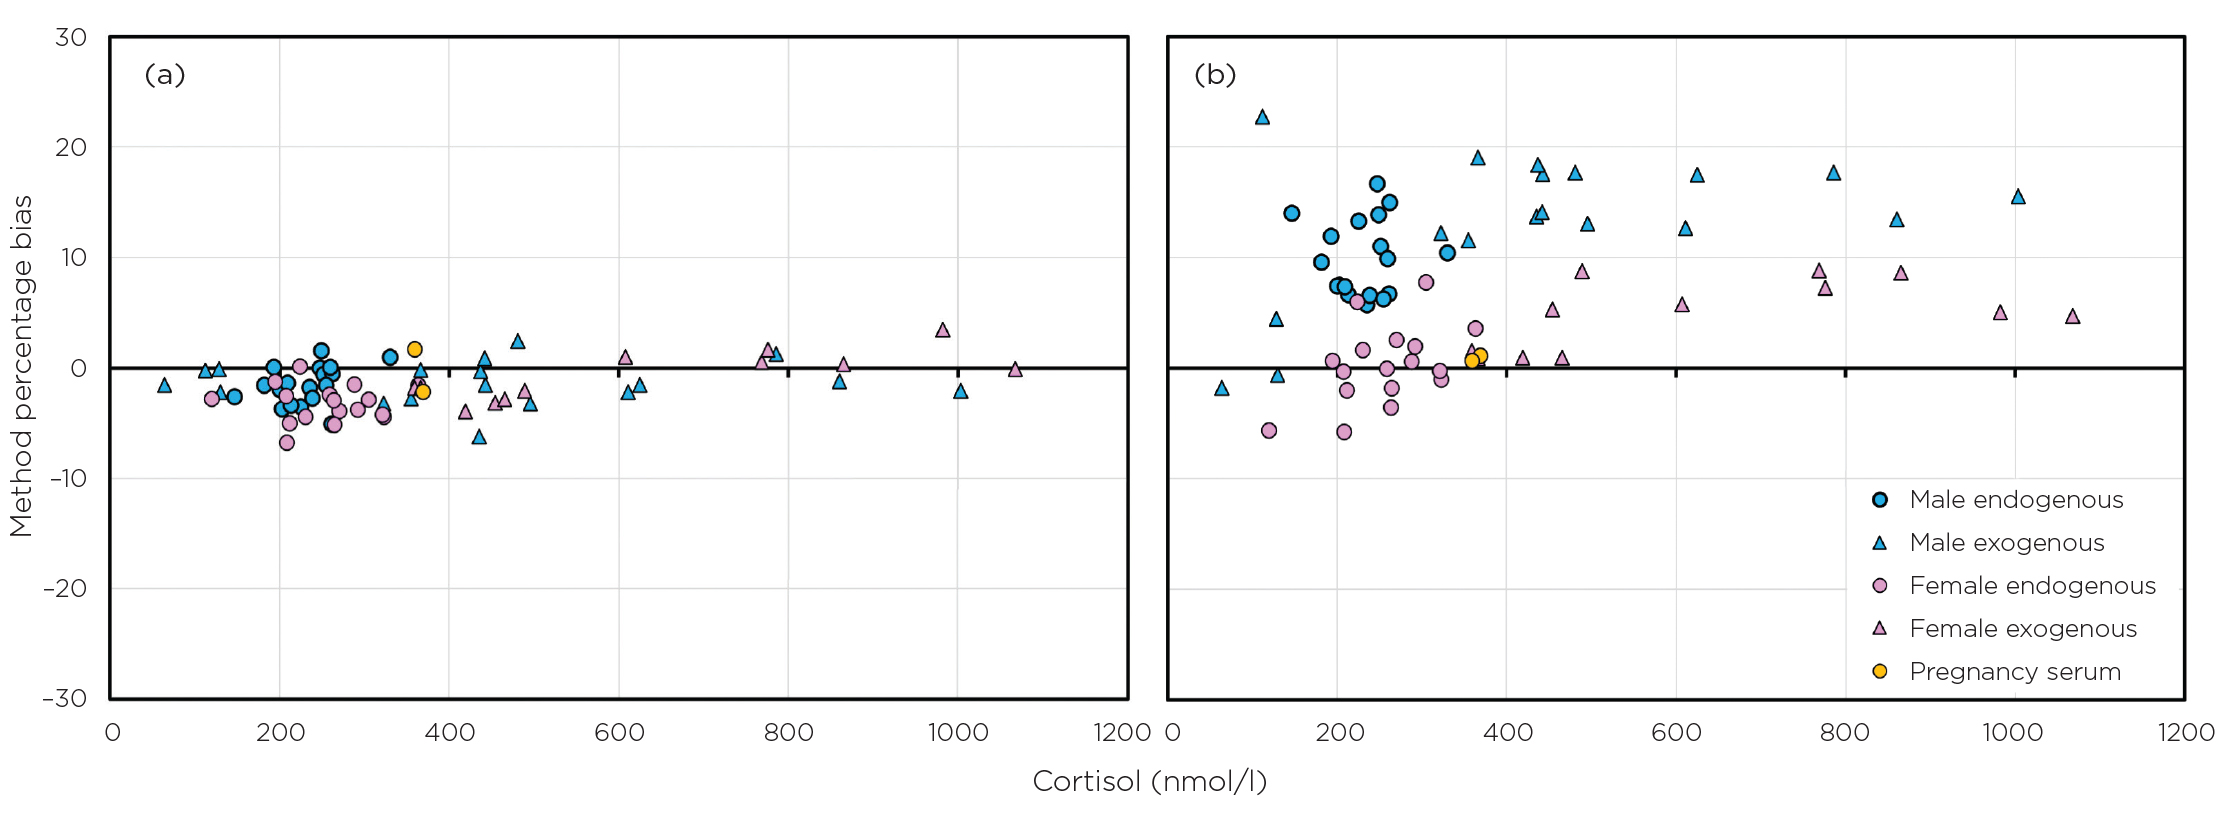
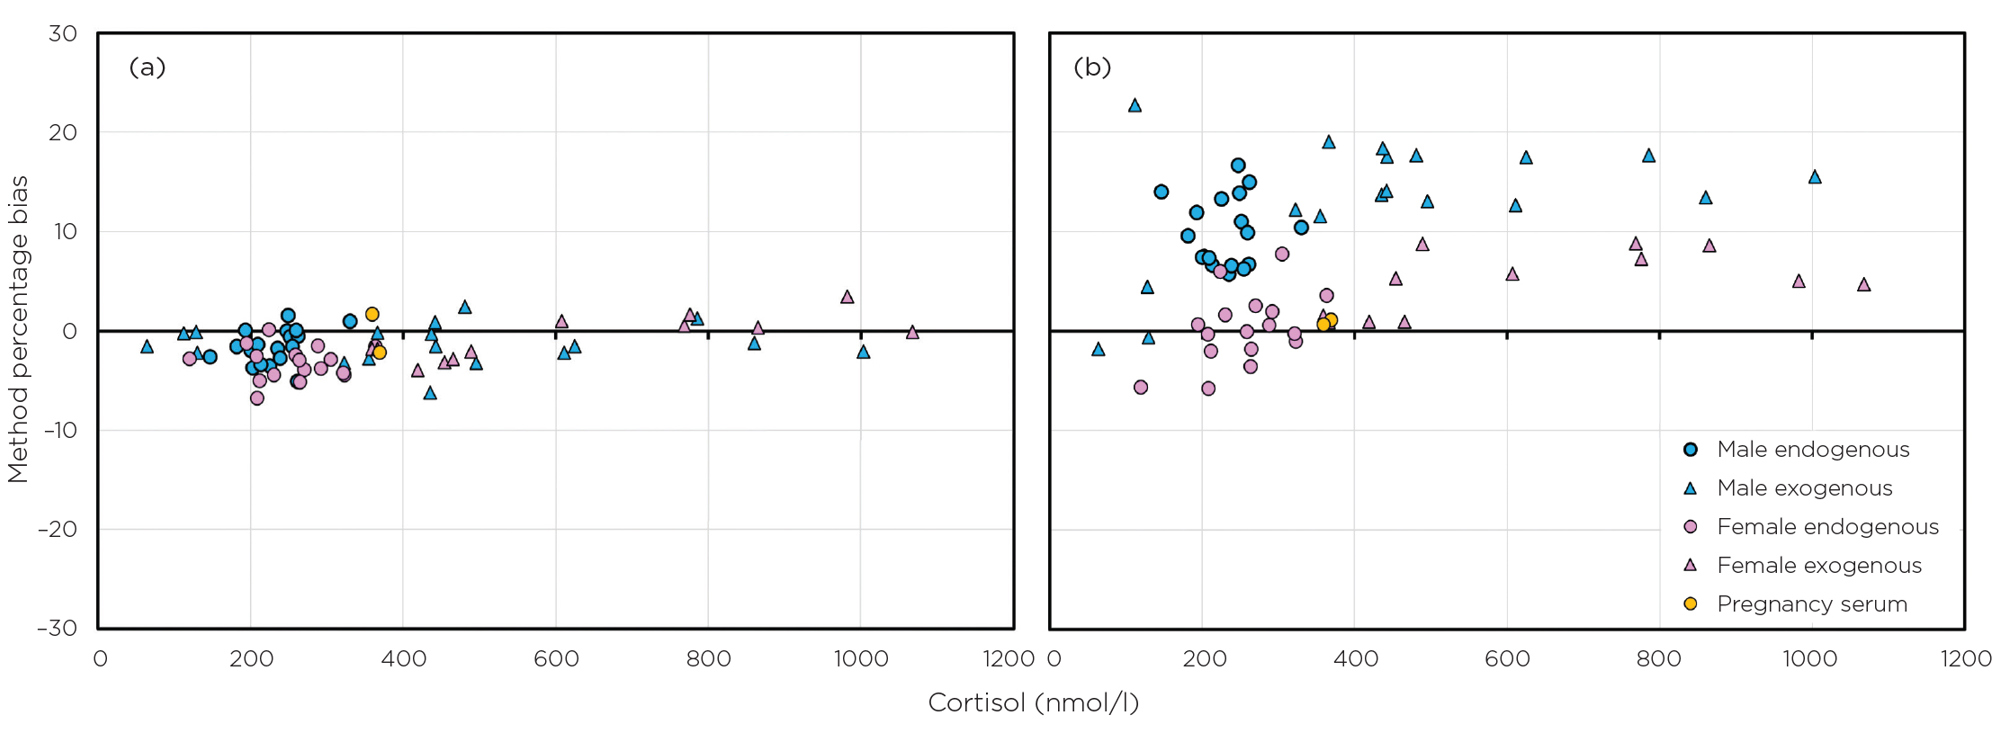
Figure 2. Sex- and method-related biases for cortisol, compared with mass spectrometry, as determined by EQA data for two manufacturers: (a) Roche (no bias) and (b) Siemens Centaur (sex-related biases). Data are from 2021–2022 using both endogenous serum and serum with exogenous cortisol added.
Cortisol is another example. It is well known that there are method- and sex-related differences and, as such, there are method-dependent cut-offs for short synacthen tests5 and sex-related, method-specific, reference ranges are given by manufacturers. Cortisol is an analyte for which there is a reference method, and so the exact amount can be quantified by mass spectrometry assays. A number of UK laboratories do, in fact, use this more specific method of analysis for a few of the steroid hormones, but we lag behind some countries in this area. Figure 2 shows the sex- and method-related biases for cortisol, compared with mass spectrometry, as determined by EQA data for two manufacturers (one with no bias and one with sex-related biases). Cortisol assays are different.
EQA data provide a good means of seeing how a method–manufacturer combination performs over a period of time.2,6 Some methods, for some manufacturers, are very stable over time and there is very little deviation in their biases. However, other method–manufacturer combinations can be highly variable. Formal, product-wide, recalibration is infrequent. When it occurs, clinicians should be informed by their laboratory. However, the far more frequent lot-to-lot variation changes in reagent formulation can cause significant differences in results. Your laboratory will be able to look at seismograph plots on their UK National External Quality Assessment Service (NEQAS) reports to probe trend data.

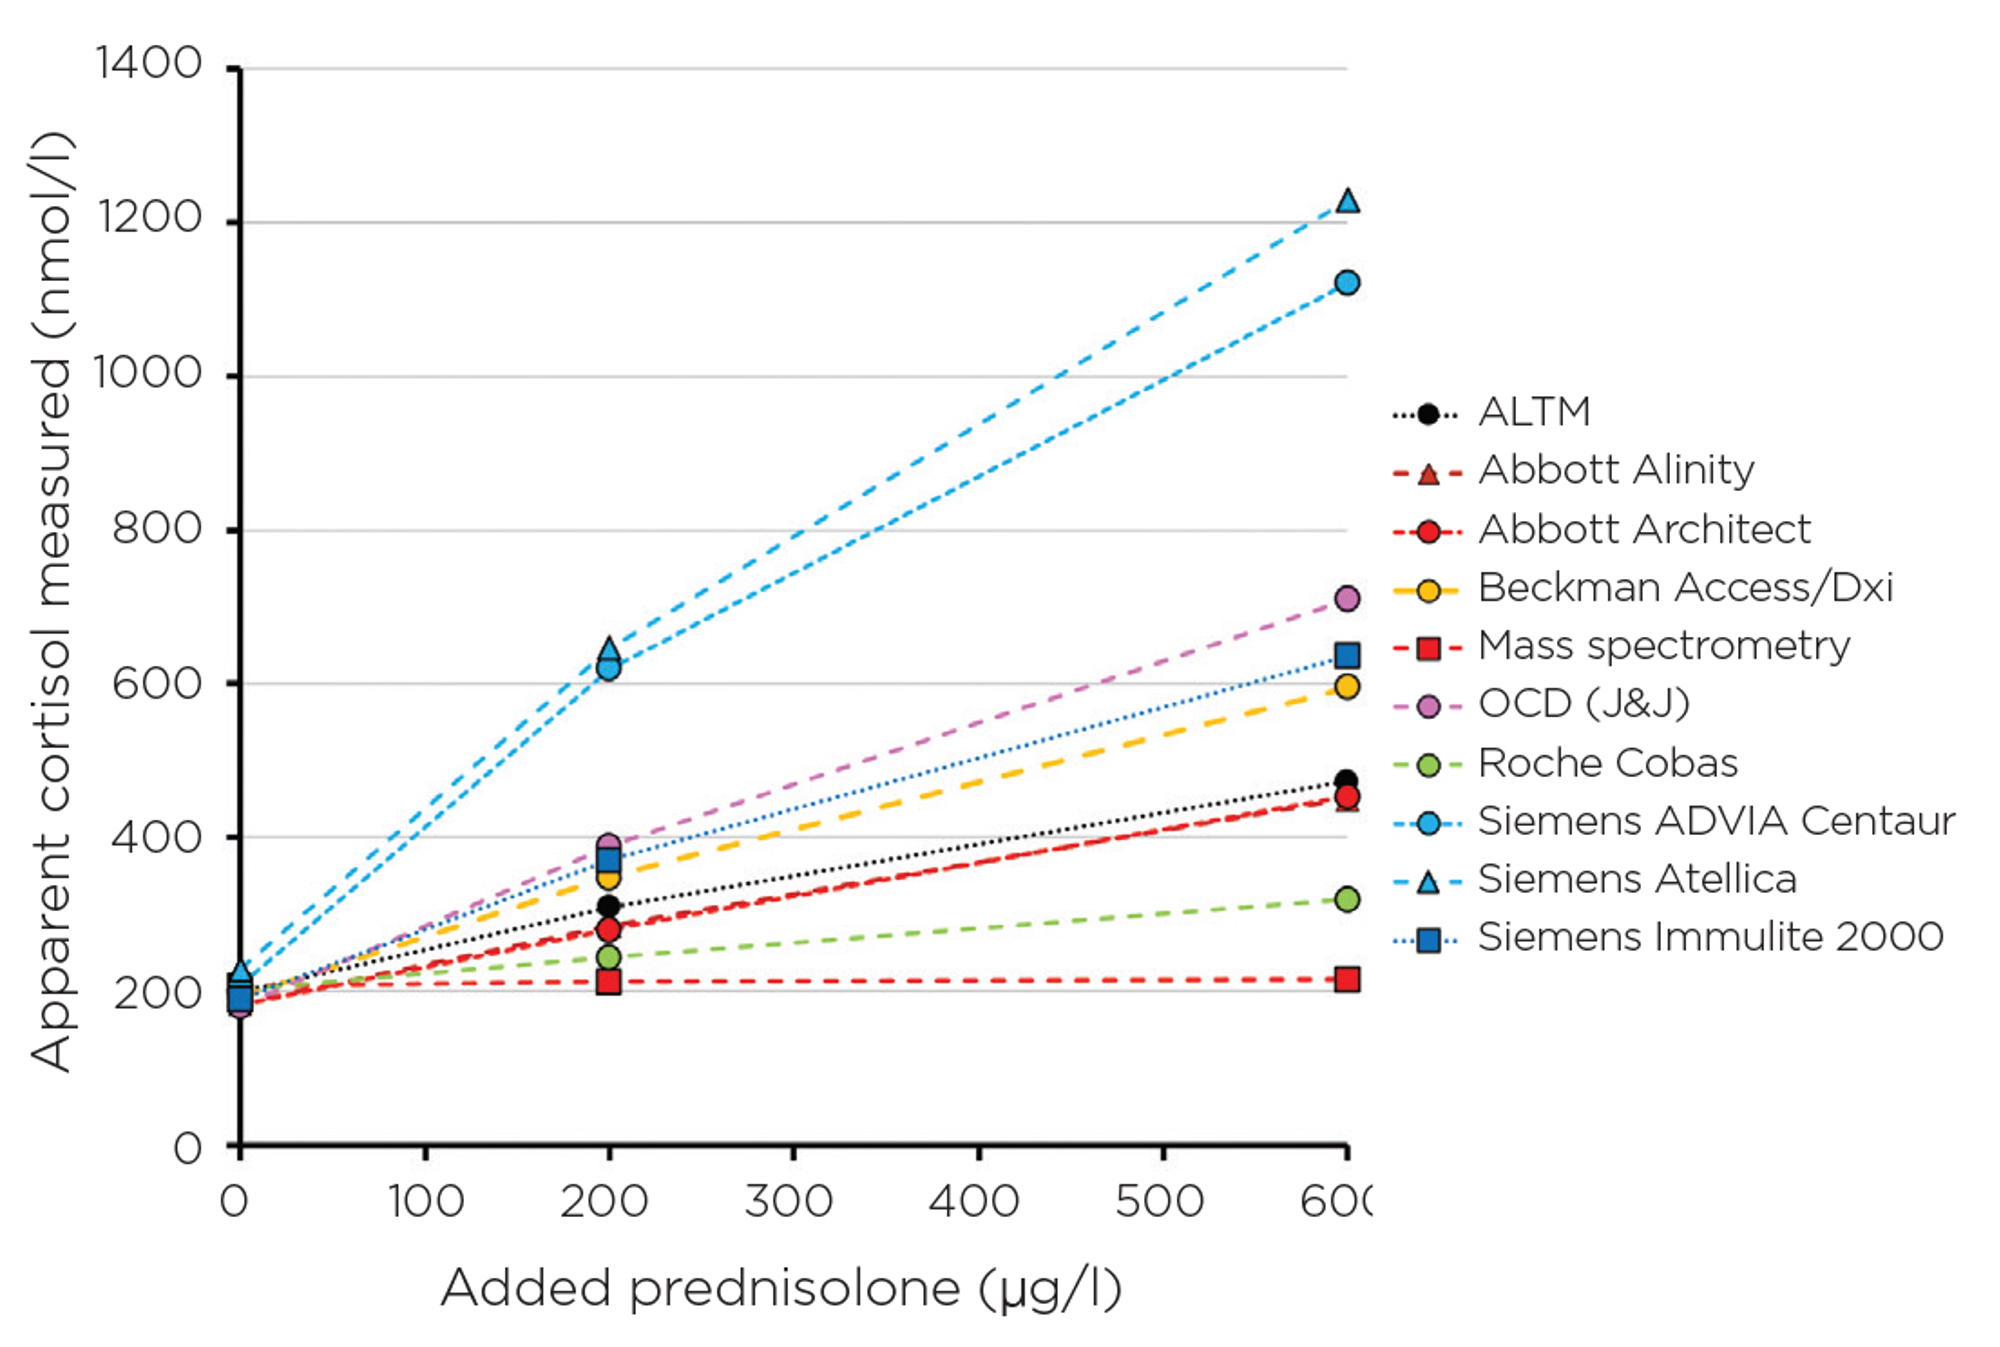
Figure 3. Apparent cortisol measurement for different manufacturers with increasing amounts of prednisolone, a structural homologue of cortisol, widely used for steroid replacement.
INTERFERENCE
Every immunoassay is prone to interference, and the degree of interference may be manufacturer-specific. Interference could be due to specificity issues from closely related homologues. Examples include prednisolone (Figure 3) and 11-deoxycortisol interference in cortisol immunoassays7 (11-deoxycortisol levels increase with use of metyrapone in the treatment of Cushing’s syndrome), and norethisterone in testosterone immunoassays,8 to name a few. Once again, these are detailed in specific manufacturer kit inserts, but is this information always communicated to the requesting clinician? Probably not. Other interferences include haemolysis, icterus and lipaemia, as well as proteins or antibody effects.9
USE OF ASSAY
Just because there is a commercially available assay, it should not be assumed that it is, indeed, fit for the purpose for which you intend to use it. The manufacturer will always detail the intended use and limitations in their kit insert. It is the responsibility of the laboratory to verify that all assays are suitable for their use.
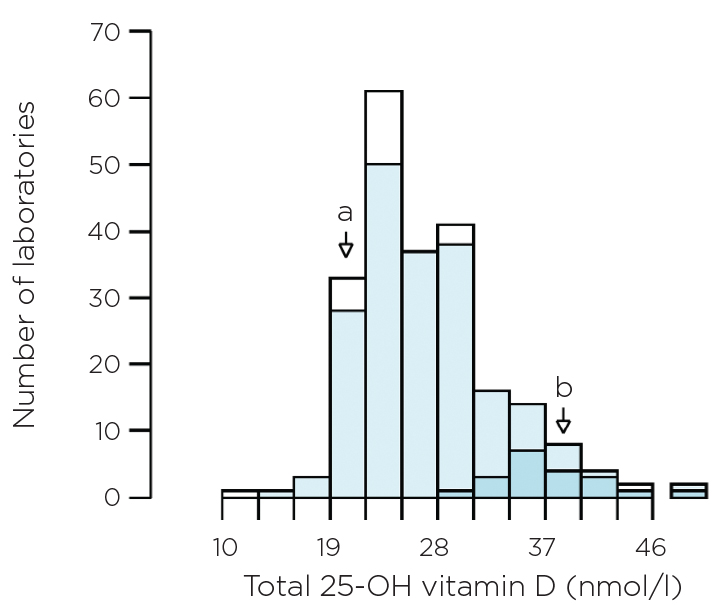
One notable example are the immunoassays for total vitamin D. A number of kit inserts state that the assay should be used in the assessment of vitamin D sufficiency, whereas in reality the test is predominantly, if not exclusively, used to aid diagnosis of deficiency. Performance at low vitamin D concentrations is important. However, this is not always accurate or consistent between manufacturers, even when assays are performing ‘within their specifications’. Figure 4 shows EQA results on pooled human serum, with a reference method total vitamin D value of 22.8nmol/l, but some laboratories reported results >35nmol/l.
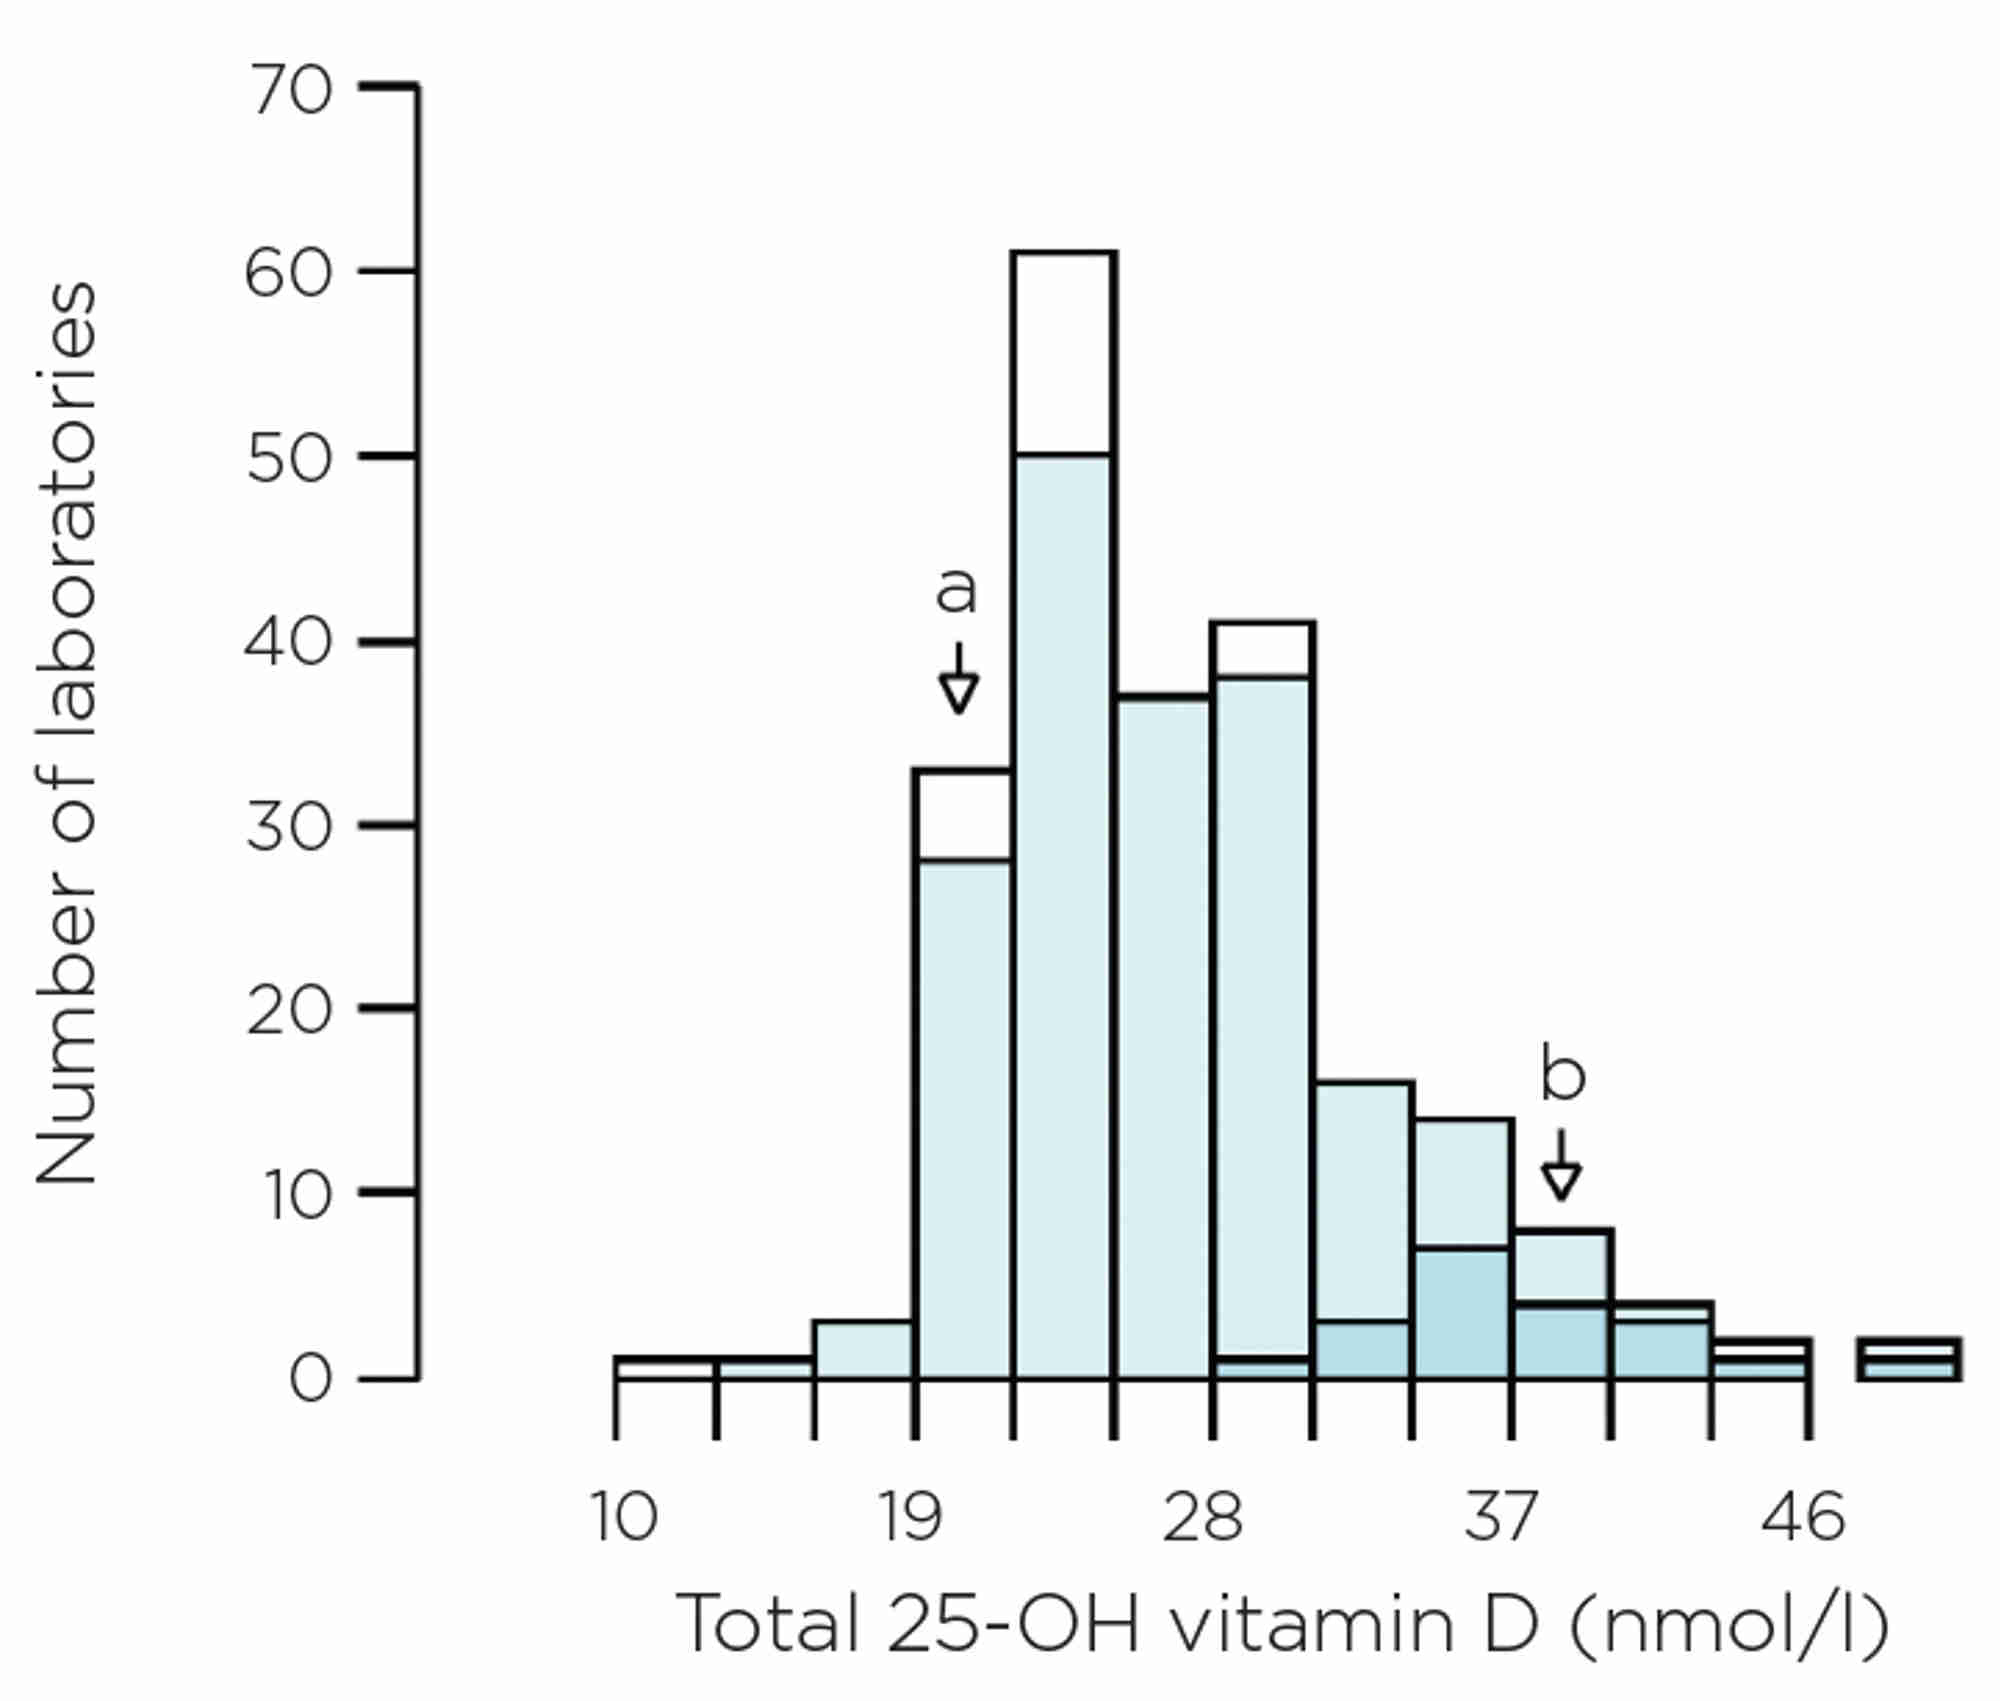
Figure 4. EQA data on pooled human serum. The histogram shows all data, but darker blue sections relate to the Siemens Atellica, light blue sections are all immunoassays, and the white sections are mass spectrometry. The reference method total vitamin D value of 22.8nmol/l is shown by arrow a and the method mean for Siemens Atellica is shown by arrow b.
DOES IT MATTER?
Only you can answer this. If you use guidelines with hard cut-offs that don’t take into account method differences, or if you have patients who have their specimens analysed by a different laboratory, or if you monitor results over a long period of time, or if you are involved in multicentre research studies, then yes – it probably does!
You can find out the impact for your patients by asking your local laboratory probing questions about their assay systems. Simply asking if all assays have acceptable performance may not be sufficient, as it may be that not everyone in the laboratory fully appreciates the limitations of the service that they are offering.
TAKE HOME MESSAGES
- Laboratory tests are crucial in helping you in your clinical practice, and are generally performed to a very high standard.
- Not all manufacturers’ assay kits behave in the same way, and they don’t all give the same results for the same test.
- Immunoassays, by their very nature, are non-specific, as they measure different parts of similarly structured molecules. They are therefore prone to potential interference. Some laboratories may use mass spectrometry, which is more specific.
- Sometimes primary and secondary care specimens go to different laboratories and these laboratories may use different methods.
- Good regular dialogue between you and your local laboratory is imperative, so you know which manufacturer’s assays are being used and how they are performing. Ask to see EQA summaries and long term trend data at your multidisciplinary team or similar meetings with the laboratory.
- Research studies regularly span several years, and it is important to be aware that assays can change over time, due to calibrator or reagent lot number shifts.
RACHEL MARRINGTON AND FINLAY MACKENZIE
Consultant Clinical Scientists, Birmingham Quality (UK NEQAS), University Hospitals Birmingham NHS Foundation Trust
REFERENCES
- Middle J 1998 Annals of Clinical Biochemistry 35 354–363.
- MacKenzie F et al. 1991 Annali dell’Istituto Superiore di Sanità 27 453–457.
- Ekins R 1991 Scandinavian Journal of Clinical Laboratory Investigation Suppl 205 33–46.
- Kratzsch J et al. 2021 Clinical Chemistry & Laboratory Medicine 59 1013–1023.
- El-Farhan N. et al. 2013 Clinical Endocrinology 78 673–680.
- Sturgeon C 2013 Methods in Molecular Biology 1065 291–305.
- Owen LJ et al. 2010 Annals of Clinical Biochemistry 47 573–575.
- Jeffery J et al. 2014 Annals of Clinical Biochemistry 51 284–288.
- Selby C 1999 Annals of Clinical Biochemistry 36 704–721.


